Sunday, October 30, 2011

Central Bank Interventions in forex - (This can ruin your account in just few minutes)

From this post I am going to explain about central bank interventions in foreign currency exchange. Though this is not that common incident in forex market, it is important to have an idea about these interventions because these interventions happen to the opposite direction of the main trend or can ruin your trading account in just few minutes if you don't have a stop loss.

Why these central bank interventions happen?

The value of their currency is very important for all the countries and if the currency is strong, it is supposed to have a good economy in that country. But if the currency is too strong it affects to the exports of that country badly because the value of exports also increased and demand is decreased according to that. The best example for this is Swiss frank(CHF). So to overcome this problem the value of the currency should be kept in an acceptable range. The central bank of that country decides that and if the price is not within that range, bank corrects the price and this correction procedure is called as the central bank intervention in foreign currency exchange.

What is the danger of these interventions to forex traders?

Usually all the traders trade to the direction of the main trend but these interventions occur to the opposite direction of the main trend and usually price is changed from about 200-300 pips within a very small time usually within few hours. You can see such intervention in the figure below but it is about 4 times bigger than an usual intervention.
Central bank intervention in GBP/CHF chart


Can I identify these inventions before they happen?

It is really difficult to tell the exact time that it happens but you can get an idea whether an intervention is likely to happen or not by studying the opinions of the central banks about their currencies and interest rates. If the interest rates are reduced they want their currency to be weaken or their economy is going down. Sometimes you have to be aware of market rumors about these interventions. However it is not that easy to catch these big movements.

I don't use a stop loss but I monitor my trades always so I can close my trade if it goes to the opposite direction so why it is difficult to do it here to prevent my account from a sudden unexpected intervention ?


When these interventions happen, price is decreased or increased with a very high rate sometimes it is changed from about 30 pips just within a second. So when you try to close your trade, you will probably get re quotes in MT4 software and finally end up with a big loss or even with a margin call. So it is very important to have a stop loss to prevent your account from this kind of things( you should never trade without a stop loss)

I think that you got a good idea about this CB interventions and try to be aware of them. Central banks never think about traders like us.

Saturday, October 29, 2011

Ascending triangles 1

Ascending triangle in NZD/JPY chart
In this post I am going discuss about how to trade on ascending triangles. These triangles have really worked for me and I like trading on breakouts in these triangles. Also a very good chart pattern to take trades with minimum risk. Here I discuss about the triangles which are bounded by a dynamic support line and a resistance line resistance line is shown in yellow. Here what happens is price tries to go up by making higher lows. When price meets the resistance line, again it comes back to dynamic support line and makes another higher low. After meeting dynamic support line again it goes to meet resistance line and comes back again to support line.  This happens repeatedly until price breaks the resistance line.

Because this is an uptrend, it is better to take only buy orders (go long).  When price goes up after meeting the dynamic support line, you can buy and you can take the profits when price meets the resistance line.  You can place your stop loss below the dynamic support line  or just below the previous low.

Important -
  • Usually the breakouts of these ascending triangles occur to the upside most of the times. Because of this reason and as this is an uptrend it is better to go only for buy orders (go long).
  • Take trades after price met the dynamic support line at least 3 times. ( After making at least 3 higher lows ).
  • It is better to place your take profit target just below about 5 pips from the resistance line because sometimes price may not come to exactly to the resistance.
  • Sometimes price goes few pips above  from the resistance and it is normal and you should not think it as a breakout.


Breakouts in Ascending triangles

When trading on breakouts in ascending triangles, you can place a buy stop order at least 15 pips above  from the resistance line  and place your stop loss at least 10 pips below from the resistance line. You can see an upside breakout on EUR/USD chart in the figure given below.

Important -
  • Usually breakouts occur with larger candles comparatively to other candles.
  • Sometimes it is better to wait until the candle which occurs at the breakout to close above the resistance at a reasonable height before entering to trade. ( To get away from false breakouts )
  • If the breakout to the upside was a false one, then the second real breakout is most likely to occur to the down side ( I have experience this number of times)
Breakout of ascending triangle in EUR/USD chart
Sometimes breakouts in ascending triangles occurs to down side also. You can see a downside breakout in NZD/JPY chart in the figure below. If you wish to trade on these breakouts you can place a sell stop order below the previous low of the triangle then your stop loss should be above the previous low. It is shown in the figure clearly.

Down side breakout of an ascending triangle in NZD/JPY chart
There are several types of ascending triangles and I hope to discuss about them in future posts. So try to identify these triangles in your charts and get some practice on trading these triangles in your demo account.

Forex Patterns & Probabilities by Ed Ponsi

Forex Patterns & Probabilities by Ed Ponzi
After loosing my money at the second time, I stopped trading on my real account and I read articles about people who became successful in forex trading to get to know their opinions on forex market and their experiences. I could find that lot of professional traders has recommended this book to read. So I downloaded it and started reading. While reading this book I could understand how valuable it is and I read it to the end without doing anything. Really I could learn a lot of things that are unable to learn even doing several months of trading. There were good strategies, entering and exiting techniques, specific chart patterns and a lot of valuable stuff. It really changed my trading style and thinking methods about market. So I recommend all the beginners to read this book beginning to the end and it never becomes a time wasting. You can easily find this book. So please read this if you want to be a successful trader one day.

Channels & Breakouts in Channels 1

Channel in USD/CHF Daily Chart 
Most of the times channels are made with two parallel lines (dynamic support line and a dynamic resistance line). So the price moves inside the channel and these two lines are the boundaries for price. You can easily understand that the trend is an downtrend(bullish trend) in the chart in above figure. There are channels without any clear trend and they are called horizontal channels. I hope to talk about horizontal channels from another post. Here as this is an downtrend it is better to take only sell orders when price goes down after meeting the dynamic resistance line(white line). See this to know how to enter trades.You can see lot of channels in GBP/USD charts and it is one of the favorite pairs of most of the traders. Channels can be seen in every time frame.

Important - Price doesn’t go inside the channel for a very long time so it is better to take about 2 trades to the direction of the trend because it takes us some time time to identify the channel and draw the lines and by that time about half of the channel has been formed and small amount of time left us to trade in the channel.

Breakouts in Channels
Channel in GBP/USD Chart
 
Break out means price go beyond support line or resistance line by penetrating these lines. All the channels are broken after some time so we should have done what we want before the breakout.

Real breakoutsAfter breaking the boundaries(dynamic S&R lines)of the channel, price goes further some considerable  amount of pips which is equal to the width of the channel. It is shown in the figure and the width of the channel is shown with yellow arrows.

False breakoutsAfter breaking the boundaries(dynamic S&R lines)of the channel, price doesn’t go considerable amount of pips and again returns inside the channel.

ImportantUsually if the first breakout is a false break out and if price returns again  inside the channel then next real break out is most likely to occur in the other direction. If first false breakout is an upside breakout then the second real breakout occurs most of the times to the downside. If first false breakout is a downside breakout then the second real breakout occurs most of the times to the upside.

If you hope to trade on breakouts on channels, you should enter to the trade after price has penetrated the dynamic support or resistance line and gone at least 10+ pips away from the line. your stop loss should be placed other side of the line at least 10+ pips  away from the line (inside the channel). You should take the profits when price moved an equal amount of pips to the width of the channel. It is shown from yellow arrows in figures.
Trading on Channel Breakouts

Friday, October 28, 2011

How to test whether you can be profitable in forex or not without loosing money ?

A lot of beginners say that the demo account is not working for them to improve their trading skill.  This is because they don’t care about trading on demo as they don’t loose their real money. So from this post I am going to tell you how to use demo account to practice trading before you go into trade in real account. If you use this method to practice, it is guaranteed that you will never loose your money and you will be able to develop a good trading plan and a trading discipline.

  1. First you have to open a demo account under a good forex broker who offers at least about 20 currency pairs and charges small spreads.
  2. Usually brokers give about 50000 USD as virtual money. But don’t try to trade big lots like 1 or 2 lots. I recommend you to trade 0.01 lots as it is the minimum lot size and if you are going to open a real account with 100 USD it is the recommended lot size to trade with minimum risk.
  3. Then next step is to set a target to achieve. Your target should be a profit of 100 USD as you trade 0.01 lots. If initial amount of demo account is 50000 USD, you have to increase your balance to 50100 USD to start trading on real account.
  4. So start trading on demo until you reach the balance of 50100 USD. If you cant achieve that target you are not qualified to trade on real account. In first few months probably you will end up with losses even without maintaining the initial deposit. Never mind that it is the nature of forex. Everyone looses at the beginning.
  5. Think that demo money as your real money and always try to be disciplined when entering to trades. Try to learn as much as you can reading ebooks and articles while trading to gather a good knowledge.
  6. Don’t try to increase lot size and always keep it as 0.01 because if you loose, it is very hard to recover as it is a big amount and if you win and achieve the target, you might feel overconfidence about your performances and it is not good for trading.
  7. After the end of the month look at your loosing trades and try to find out reason for those trades. Also look at your winning trades and try to remember those chart patterns that were successful. Waiting until best opportunities to appear in charts to trade is very important. You don’t need to trade always and if you get confused by chart patterns, don’t enter to trades and watch a movie. It is very important to protect your profits from previous trades.
  8. Don’t let loosing trades to go more than 100 pips and don’t expect that loosing trades will  become wining trades after some time because price might never return to that position.
  9. As it is very hard to catch a winning trade, hang on winning trade as much as you can if there are no supports or resistances nearby. Sometimes we can hold winning trades for several days if it is going our way.
  10. Start trading with confidence in your real account when you reached the target of 50100 USD with the valuable lessons that you learned from demo trading. It takes some time to achieve that and during that period you will gain a lot of experiences as experience is the most important thing in trading.
Some successful strategies which you can use to improve your trading skills are discussed later in this blog. So try above method to improve  trading skills without loosing money and getting disappointed at the very beginning.

Dynamic Supports & Resistances

Dynamic support line of GBP/USD chart


Identifying dynamic support and resistance lines is very important in forex trading because they provide us very good trading opportunities with minimal risk. The support & resistance levels that we talked about early were horizontal but  dynamic support and resistance levels are not horizontal and they are inclined to an angle.


Dynamic resistanceIn this figure price goes down while making lower highs and lower lows.  If we connect these lower highs, we see that they are in a perfect straight line with some inclination. Figure shows a dynamic resistance line in GBP/USD in 15min chart.

Dynamic supportPrice goes up while making higher highs and higher lows. If the lower lows are connected, a perfect straight line is made with some inclination.

Entering to trades with dynamic S & R

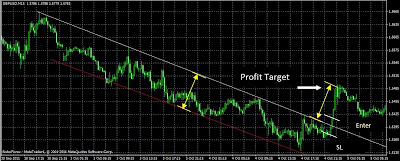
The following figure shows you how to take trades when you see dynamic S&R are in the chart. Red line is a support line and white line is a resistance line. When you see the figure, you can clearly understand that trend is an uptrend. So therefore we try to take only buy trades (long positions). When price is rising after it met the support line, we enter a buy trade and we can take profits after price reached the resistance line. So then again wait until price go down to hit the support line and when price started to rice again, take a buy trade. Your stop loss should be about 1o pips below from the support line. However it is not good to take sell trades when price goes down after meeting the resistance line.

Dynamic support & resistance lines in GBP/USD chart

Important Tips about dynamic S&R

  1. Dynamic S&R lines should be drawn by ourselves and at least 3 points should be taken to draw the line.
  2. Always place stop loss at least 10 pips beyond dynamic S or R lines.
  3. Placing stop loss below the previous low in a up trend or placing above the previous high in a downtrend is  also good.
  4. If the main trend is an up trend(Bullish) take only buy orders and take only sell orders if main trend is a downtrend(Bearish).

Is forex trading profitable?

Really the behavior of forex market is very hard to predict and very risky. Also forex can make you a millionaire or a beggar in a few minutes. So it is not that easy to be successful in forex trading. Only 5% of traders are successful and the majority is losers. We must try hard to enter to that 5%.  In forex trading someone is winning means someone is loosing in somewhere in the world. The banks and big investors are the big players in this game and we should try to do what they do and should not do against them as we are ants if they are big elephants. Following things are the most important rules in forex as I have seen and If you are a beginner, you should always remember these things.

1  Knowing that you cant always win

I have seen in lot of websites that traders providing their trading performance sheets without any loosing trades. Probably they are fake and anyone cant trade for a long time without loosing even a single trade except central banks. Very experienced professional traders also sometimes loose two, three trades in a row. So you must understand that loosing is a part of this game and only thing that we can do is reducing the number of loosing trades and also the amount of loosing.

2  Strong determination to be successful

Determination is very important not only in forex but also in any kind of work we do. At the loosing time you might end up with loosing all the positions you had at that time in different pairs. This is normal because there are correlations among most of the pairs. So after a series of loosing trades it is very hard to make our mind and for many beginners it is the end of their forex trading. If you are like that, don’t try to trade in forex anymore because you have to understand that this is the nature of forex and also you have to learn a lot of things from loosing trades. Biggest looser become the biggest winner. If you want to be a successful trader, reading books, articles, being alert for news and global economy is very important. Nothing can be achieved if you don’t spend some amount of time to learn that.

3  Trading discipline

This plays a major role in forex trading. After a loosing trade, lot of beginners try to recover it as soon as possible. This is the worst case and when you enter to trades at that  time probably you cant recover and you loose further more. So controlling our emotions is very important specially after loosing trades. Also trading very big lot sizes to become rich quickly is seen often among beginners. This is greed and should try to avoid as much as you can. Always don’t risk more than 5% of your trading capital and for beginners it is very safe to trade minimum lot size until a good experience is gained.
DreamHost coupon