 | |
| Channel in USD/CHF Daily Chart |
Important - Price doesn’t go inside the channel for a very long time so it is better to take about 2 trades to the direction of the trend because it takes us some time time to identify the channel and draw the lines and by that time about half of the channel has been formed and small amount of time left us to trade in the channel.
Breakouts in Channels
 |
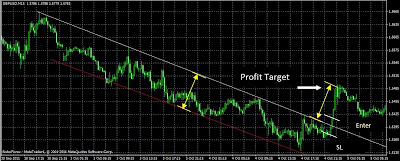
| Channel in GBP/USD Chart |
Break out means price go beyond support line or resistance line by penetrating these lines. All the channels are broken after some time so we should have done what we want before the breakout.
Real breakouts – After breaking the boundaries(dynamic S&R lines)of the channel, price goes further some considerable amount of pips which is equal to the width of the channel. It is shown in the figure and the width of the channel is shown with yellow arrows.
False breakouts – After breaking the boundaries(dynamic S&R lines)of the channel, price doesn’t go considerable amount of pips and again returns inside the channel.
Important – Usually if the first breakout is a false break out and if price returns again inside the channel then next real break out is most likely to occur in the other direction. If first false breakout is an upside breakout then the second real breakout occurs most of the times to the downside. If first false breakout is a downside breakout then the second real breakout occurs most of the times to the upside.
If you hope to trade on breakouts on channels, you should enter to the trade after price has penetrated the dynamic support or resistance line and gone at least 10+ pips away from the line. your stop loss should be placed other side of the line at least 10+ pips away from the line (inside the channel). You should take the profits when price moved an equal amount of pips to the width of the channel. It is shown from yellow arrows in figures.
 |
| Trading on Channel Breakouts |
Above Flow chart is just define here very precious and useful information of Channels regarding the lines. That parallel lines indicates the dynamic support.
ReplyDeleteFree Forex Signals